Optical Mapping
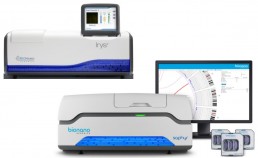
The Irys® and Saphyr™ systems from Bionano Genomics are two optical mapping instruments that allow the production of optical map data of a genome in a semi-automatic way (Figure 1).
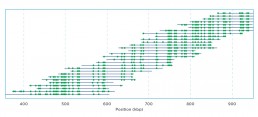
The principle of the optical chart consists in establishing an enzymatic profile of genomic DNA molecules (ADNg) based on the size and order of the fragments obtained after digestion and/or marking. By compiling several profiles from several molecules, it is possible to compile a complete map of the restriction of a genome (Figure 2), called the optical map of a complete genome (“Whole Genome Map”).
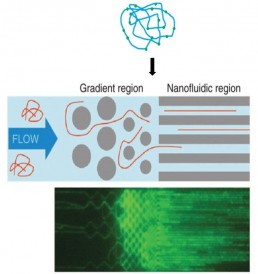
Instruments Irys and Saphyr use the same approach for optical maps but differ in their throughputs. The restriction sites of the gDNA molecules are labelled by incorporating a fluorescent marker (Figure 3). These molecules are then loaded and linearized over several cycles in nano-channels (Figure 3).
One of the difficulties in obtaining a complete optical map of genomes lies in the preparation of genomic DNA. The size of DNA moleculesg produced after extraction must be very high molecular weight (200-400 kb). For this reason, it is currently recommended to extract the gDNA from lysed cells/nuclei after having trapped them in agarose plugs. This is particularly recommended for organisms with genomes larger than 7 Mb.
The uses of an optical card are multiple. One of the first applications was the validation and improvement of genome de novo assembly . Very quickly, other uses emerged such as analysis of structural variations (translocations and CNVs (“Copy Number Variation”). More recently, the implementation of double labelling by incorporating an additional laser into the Saphyr system has enabled new research projects to be undertaken.


